
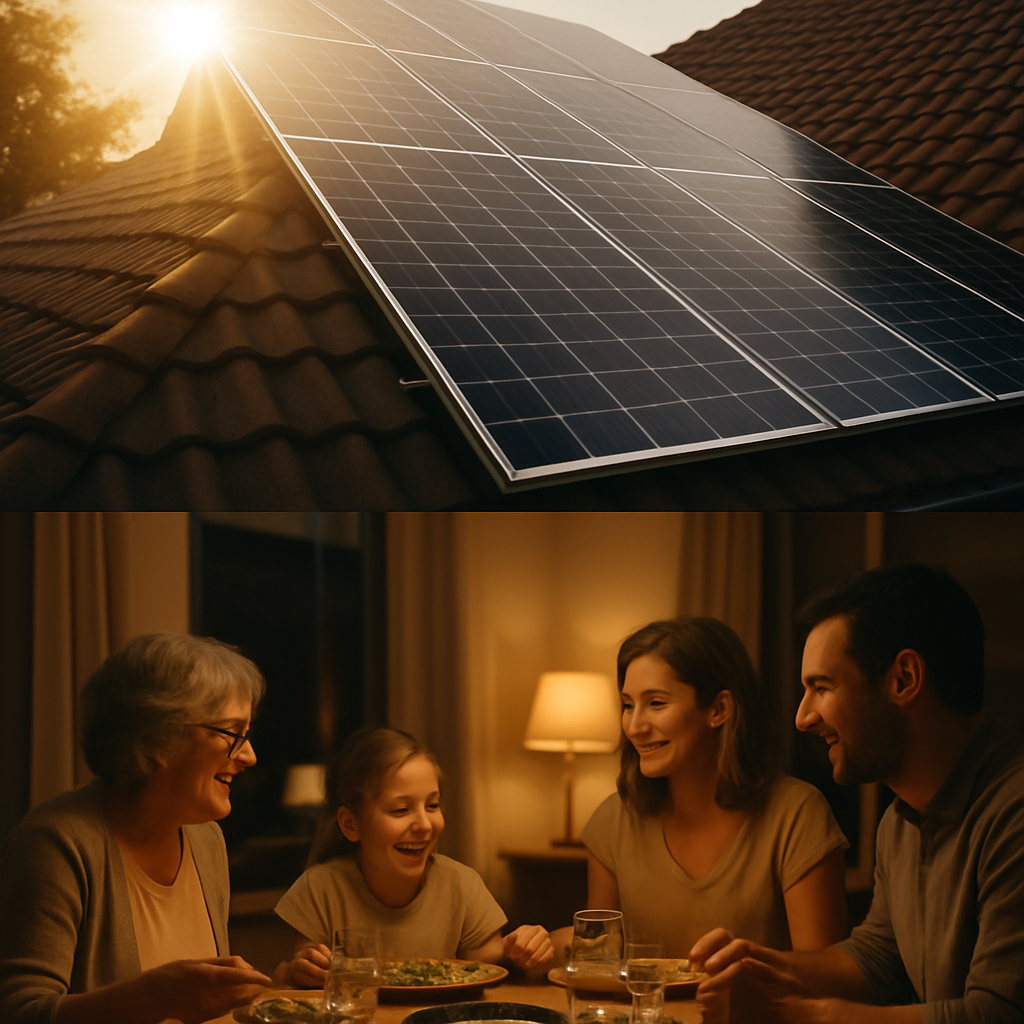
Fast Read
Monitoring your solar and battery system is crucial to ensure you're getting the most out of your investment. This is typically done through a dedicated app provided by your inverter manufacturer (like Enphase or SolarEdge) or your battery provider (like the Tesla Powerwall app). These apps show real-time data on how much energy your panels are generating, how much your home is consuming, what's being stored in the battery, and how much is being sent to or drawn from the grid. For more detailed analysis, third-party systems like the Australian-made Solar Analytics can be added for around $300-$600, offering advanced diagnostics and performance alerts. Key metrics to watch are your daily solar generation (in kWh), your home's energy consumption, and your battery's state of charge.
How to monitor your solar and battery system performance
The best way to keep tabs on your solar and battery system is by using a monitoring platform. These platforms are your window into the system’s brain, showing you exactly what’s happening with your energy in real time.
Virtually every modern solar installation comes with a monitoring system, which you can access through a smartphone app or a web browser. This is not an optional extra; it’s a fundamental part of the package.
Your monitoring platform will typically show you four key energy flows:
-
Solar Generation: How much electricity your panels are producing right now and throughout the day.
-
Home Consumption: How much electricity your home is using.
-
Battery Status: Whether your battery is charging or discharging, and its current percentage.
-
Grid Interaction: Whether you are exporting surplus solar energy to the grid or importing power from it.
This information is displayed in a user-friendly interface with graphs and animations, making it easy to understand how energy is moving through your home at a glance.
Solar panel and battery monitoring apps
Most of the time, your monitoring app will come from the manufacturer of your solar inverter or battery. These are the devices that manage the energy flows, so their software provides the most direct data.
-
Inverter-Branded Apps: Companies like Enphase (Enphase Enlighten) and Fronius (Solar.web) provide sophisticated apps that connect directly to their hardware. These are excellent for detailed solar performance data. Sungrow’s iSolarCloud is another popular option, though some users find the app less intuitive than its competitors.
-
Battery-Branded Apps: If you have a battery, its app often becomes the primary monitoring tool. The Tesla Powerwall app is famous for its clean interface and seamless integration, showing power flows for your solar, home, Powerwall, and even your Tesla vehicle if you have one.
-
Energy Retailer Apps: Some electricity retailers, like Origin Energy and AGL, offer apps that can track your solar usage and savings, though these are often less detailed than the dedicated hardware apps.
Key metrics for solar and battery performance
When you open your monitoring app, it can feel like you’re looking at the dashboard of a spaceship. To keep it simple, focus on these key numbers to assess your system’s health and value.
-
Solar Production (kWh): This is the total amount of energy your panels have generated. Look at this daily and compare it to previous days with similar weather. A sudden, unexplained drop could indicate a problem.
-
Energy Consumption (kWh): This shows how much electricity your household used. Understanding your consumption patterns is the first step to shifting your usage to maximise solar self-consumption.
-
Self-Consumption (%): This is the holy grail of solar savings. It measures the percentage of your solar energy that you use directly in your home. A higher number means you’re relying less on the grid and saving more money. Some apps calculate this for you, but you can also estimate it by comparing your production to your consumption during daylight hours.
-
Battery State of Charge (SoC %): This is your battery’s fuel gauge. You’ll see it charge during the day with excess solar and discharge in the evening or morning to power your home.
-
Round-Trip Efficiency (%): This is a more technical metric for batteries. It measures how much energy you get out of the battery for every unit of energy you put in. Most modern lithium-ion batteries have a round-trip efficiency of around 90-95%.
Best third-party solar monitoring systems
While manufacturer apps are great, sometimes you need a more powerful, independent umpire to assess your system’s performance. This is where third-party monitoring systems come in.
In Australia, the standout choice is Solar Analytics. It’s an Australian company that provides a hardware and software package to give you incredibly detailed insights.
Key advantages of Solar Analytics include:
-
Independent Performance Analysis: It uses local weather data and satellite information to determine if your system is performing as well as it should be. If it’s not, it will alert you.
-
Fault Detection: It can identify issues like panel degradation, shading problems, or inverter faults often before you’d notice them yourself.
-
Reliable Connectivity: Unlike many inverter monitoring systems that rely on your sometimes-flaky home Wi-Fi, Solar Analytics uses its own 4G connection for uninterrupted data transmission.
-
Consumption Monitoring: It can track individual circuits in your home, helping you pinpoint which appliances are using the most energy.
The hardware typically costs between $300 and $600 to have installed by a qualified electrician, making it a worthwhile addition to protect your larger solar and battery investment.
Gigi’s Pro Tip: When choosing a monitoring system, ask your installer if it offers consumption monitoring. Without it, you can see how much solar you’re generating, but you’re blind to how much of that solar you’re actually using in your home versus exporting to the grid for a lower feed-in tariff. This data is critical for maximising your savings.
How to read solar and battery monitoring data
Let’s break down a typical day using a monitoring app.
-
Morning (7 am – 10 am): You’ll see your solar production start to ramp up as the sun rises. Your home’s consumption might also be high as you get ready for the day. Your battery, likely depleted from overnight use, will start recharging with any excess solar.
-
Midday (10 am – 3 pm): This is peak solar production time. Your panels should be generating more power than your home needs. Your battery will be charging rapidly, and once it’s full, you’ll see energy being exported to the grid.
-
Evening (4 pm – 9 pm): Solar production will drop as the sun sets. Your home’s consumption will likely increase as you cook dinner and turn on lights and entertainment. Your fully charged battery will now kick in, discharging to power your home and keeping you off the grid.
-
Overnight (10 pm – 6 am): With no solar production, your home’s low background load (fridges, standby appliances) will be powered by the battery. Depending on the size of your battery and your overnight usage, it may fully deplete before sunrise, at which point you’ll start importing a small amount of energy from the grid.
Troubleshooting solar and battery performance issues
If your monitoring app shows that your system isn’t performing as expected, don’t panic. Here are a few common issues and what to do about them.
-
Low or No Solar Production:
-
Check the weather: The most obvious reason is cloudy or rainy days. Your production will naturally be lower.
-
Inspect the panels: Are they dirty, covered in leaves or bird droppings? A good clean can sometimes make a surprising difference.
-
Check the inverter: Look for any error messages or status lights on the inverter itself. Sometimes, the system just needs a simple reset. A common first step is to perform a shutdown procedure: turn off the AC isolator, then the DC isolator, wait a minute, and then turn them back on in the reverse order (DC first, then AC).
-
-
Battery Not Charging or Discharging:
-
Check the settings: Ensure your battery isn’t in a special mode (like a “backup-only” mode) that prevents normal operation.
-
System reset: Like with the inverter, a full system shutdown and restart can often resolve communication errors between the battery and the inverter.
-
-
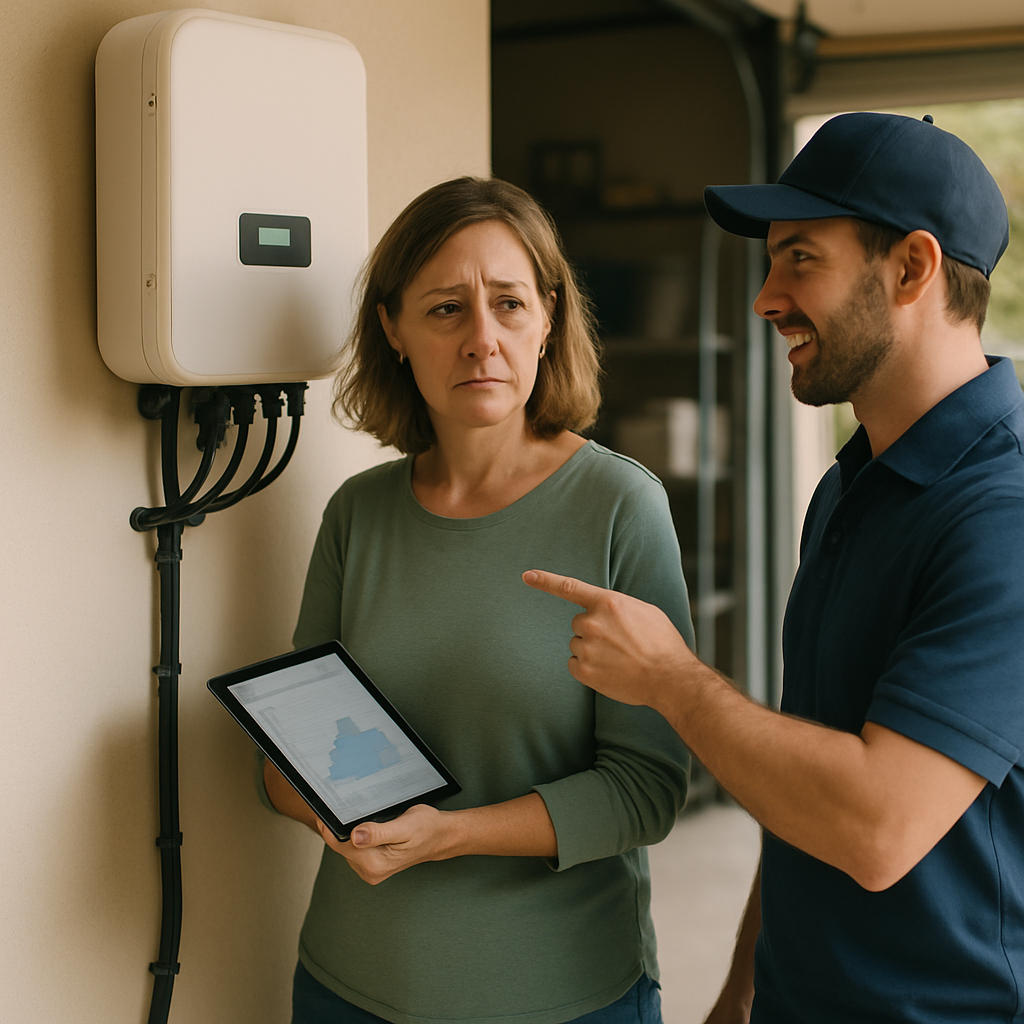
High Electricity Bills Persist:
-
Analyse your consumption: Your system might be working perfectly, but your energy usage habits may have changed. Use your monitoring app to see when you’re using the most grid power and try to shift that usage to daylight hours.
-
Contact your installer: If you’ve run through the basic checks and are still concerned, it’s time to call the professionals. Your installer should be your first point of contact for any warranty or performance issues. They can perform more detailed diagnostics. A good installer, accredited by a body like Solar Accreditation Australia (SAA), will provide this support.
-
Enphase monitoring vs SolarEdge monitoring
Enphase and SolarEdge are two of the most popular premium inverter technologies in Australia, and their monitoring platforms are a key part of their appeal.
| Feature | Enphase Enlighten | SolarEdge Monitoring |
|---|---|---|
| Technology | Microinverters (one per panel) | Central inverter with power optimisers (one per panel) |
| Monitoring Level | Per-panel monitoring is standard. You can see the individual performance of every single panel on your roof. | Per-panel monitoring is also available, thanks to the optimisers. |
| Reliability | No single point of failure. If one microinverter fails, the rest of the system keeps working. | Has a central inverter. If it fails, the entire system goes down until it’s repaired or replaced. |
| User Interface | Homeowners often praise the Enphase app for its clean, intuitive interface and detailed panel-level view. | The app is also highly functional, providing comprehensive data and performance alerts. |
| Expandability | Very easy to add more panels later, as each one has its own microinverter. | Can be more complex to expand, as it may require resizing the central inverter. |
From a monitoring perspective, both systems are excellent because they allow you to see the performance of each individual panel. This makes it incredibly easy to spot a single faulty or underperforming panel, a task that’s nearly impossible with a standard string inverter system.
Tesla Powerwall app features
The Tesla app is widely regarded as one of the best in the business, offering a seamless and intuitive way to manage your home energy.
Key features include:
-
Real-Time Power Flow: A beautiful animation shows exactly where your energy is coming from and going to in real time—solar, Powerwall, grid, or home.
-
Customisable Modes: You can easily switch between modes. “Self-Powered” mode maximises your use of solar, while “Time-Based Control” can be set to charge from the grid during cheap off-peak times and sell back during expensive peak times to maximise your financial return.
-
Backup Reserve: You can set a percentage of the battery to hold in reserve for a power outage, giving you peace of mind. You can easily adjust this slider from 0% to 100%.
-
Storm Watch: If a severe weather event is forecast, the app will automatically charge your Powerwall to 100% from the grid, ensuring you’re prepared for any potential blackouts.
-
Energy Insights: The app provides detailed historical data, allowing you to track your savings and see your journey towards energy independence.
Case Study: A Family in The Gap The Kumar family was facing quarterly power bills of over $600. They installed a 6.6kW system with Trina panels and a 10kWh Sungrow battery for a total cost of $15,500. Their annual savings are now over $2,200, putting them on track for a payback period of around 7 years, and their last bill was only the daily grid connection fee.
How to check solar panel degradation
All solar panels lose a small amount of their production capacity over time; this is called degradation. A typical panel is warrantied to produce at least 80-85% of its original power after 25 years, which equates to a degradation rate of less than 1% per year.
It’s difficult to spot this slow decline with the naked eye, but your monitoring system can help.
-
Compare Year-on-Year Data: Look at your production data for a sunny, clear day this year and compare it to the data from the exact same day a year or two ago. If you see a significant drop of more than a few percent, it might warrant investigation.
-
Use a Third-Party Monitor: This is where a service like Solar Analytics shines. Its algorithm is specifically designed to account for weather conditions and identify when your system’s output is lower than it should be, which can be an early sign of accelerated degradation.
-
Professional Testing: If you suspect a serious issue, an SAA-accredited solar technician can visit your property and use a multimeter to test the open-circuit voltage (Voc) and short-circuit current (Isc) of your panels directly, comparing the readings to the manufacturer’s specifications.
Monitoring your system doesn’t have to be a daily chore. A quick check of your app once a week is usually enough to ensure everything is running smoothly. By understanding what the data means, you can take control of your energy, maximise your savings, and ensure your system delivers value for decades to come.
If you’re unsure about your system’s performance or want to explore options, I can connect you with a trusted local expert who can provide a detailed assessment. Just fill out the form below for guidance.